

General
Q: How much time does it take to complete an ACORN questionnaire?
A: Our questionnaires are 19 items on average, which takes about two minutes to complete. We also have a texting option under the Mobile Forms page that allows a client to fill out the form at any point before the session.
Q: How often can the ACORN questionnaire be administered and still detect change?
A: At every session.
Q: What will the set-up process be like?
A: We're an online platform so you won't need to worry about downloading any software or setting up licenses. After you sign up, we'll send your staff a new user email with all of the information necessary to log in to the Toolkit.
Q: Do you have a form for addiction recovery?
A: Yes. Our Recovery forms come in individual and group therapy versions.
Q: How do you measure outcomes in group therapy?
A: Let us know if you have groups at your agency. After the groups feature has been enabled for you, you will manage it under Admin>Organization Settings.
Q: Can ACORN be used for severely mentally ill (SMI) populations?
A: Yes.
Q: What if a client transfers clinicians?
A: The Toolkit automatically tracks changes in the therapists. Anyone who has seen the patient at any time can track the outcome, but the Toolkit will display who the most recent clinician is. In the case of a clean transfer, this makes sense.
Some are multidisciplinary, where a patient may see more than one provider (therapist & prescriber). In these cases, assigning the outcome to a particular clinician doesn't make much sense, as the case really belongs to the team. So, depending on the nature of the clinic, the responsibility for the case may rest with a particular clinician, or really is seen as shared, team responsibility.
Q: What can I do to Improve my Score?
Q: What is measurement based care?
Data and Summary Page

Q: What does the green icon of people mean?
A: That icon means that the case represents the forms for a client that was filled out by a parent or guardian. The toolkit separates these cases from those that were filled out by the youth even though both entries will have the same ID number.

Q: What does the blue checkmark icon mean?
A: The checkmark icon means that a registration form (which contains demographic and diagnosis information) has been submitted for that client
Q: What is the case count?
A: The case count is the total number of clients that have completed at least one questionnaire within the time period specified.
Q: What does effect size mean?
A: The effect size is a standardized method of measuring the magnitude of improvement among clients.
Q: How can I tell if my effect size is shows that I am providing effective treatment?
A: Effect sizes of 0.8 or larger are considered “providing highly effective treatment”, while effect sizes of 0.5 to 0.8 can be considered “providing effective treatment”. Effect sizes less than .5 are considered “providing treatment that does not have a statistically meaningful impact with regard to improving outcomes”.'
Q: Does filling in the diagnosis details on the Client Registration form change the way effect size is calculated?
A: Yes, effect size does take into account the diagnosis(es) you provide on the client Registration form. In reality, diagnosis accounts for little of the variance in outcome, with the exception of psychotic disorders. In our predictive modeling (multivariate general linear modeling) the diagnosis cluster accounts for less than 2% of the variance in outcome.
Q: Why can’t I see all of my data for all of my clients?
A: There are a few reasons that could be causing you to be unable to see your data. Check the filters at the top of the main toolkit page. Make sure that the filters are not set in a way that might prohibit the data from being shown, Report Type and Date Range are particularly important filters to watch out for.
Go to the Forms Processed on the Home drop down menu for a complete list of your submitted forms.
If you're still having trouble after checking that your Org, Site, Clinician and Client IDs are correct, submit a request on the Help drop down menu.
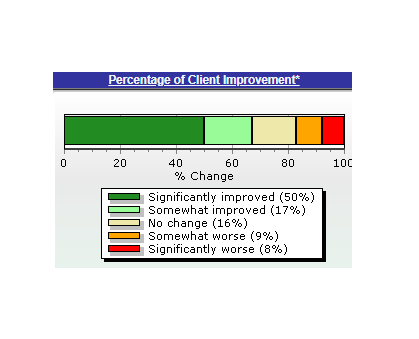
Q: What does the “Percentage of Client Improvement” graph show?
A: The Distribution of Change graph provides information on the percentage of patients who show change on the questionnaire. The dark green represents clients who are reporting that they are benefitting from services. Change (or lack thereof) experienced by clients in the light green, yellow, and orange portions cannot be attributed reliably to the services they are receiving. Client in the dark red portion are significantly deteriorating in the context of the services they are receiving (i.e. the current design of services are not effective with this client).

Q: What is the “clinical message”?
A: The clinical message is intended to help you identify clients who are at risk, clients who are on track, and clients who may be ready for discharge. It uses client reported data to highlight clients with specific risk factors, warn clinician of those patients at greatest risk for premature termination with a poor outcome, identify clients most likely to show gains with continued treatment, and those who are least likely to need continued services.
Q: How does a new episode of care get created? (Client Data page)
A: Any time you submit a Questionnaire for a new client the toolkit will create a new ‘case’ to track the data for the client over time. Any subsequent questionnaire that you submit for that client will also route into that case unless it is 120 days apart from any other questionnaire, in which event, it will be considered a separate treatment episode and will have its own case. The toolkit will also create separate cases for youth clients that were filled out by a child vs. those filled out by a guardian.
Graphs

Q: How do I make/view a client graph?
A: Check out this tutorial.
Q: What is the projected change (purple line)?
A: It is the expected change your client will experience if services are helpful. This line is determined using your client’s age, initial distress score, and the information from all the other clients that are in the CCI database.
Q: What goes into calculating the Global Distress Score (GDS)?
A: The GDS is a simple average of scores from questionnaire items in four domains which include: symptoms; functionality; social; and risk. In other words, it represents the client’s perspective on how distressed they are as represented by their individual answers on the ACORN.
To calculate GDS, each rated item in the symptom section is assigned a value from 0 to 4. The values of all the items (excluding substance use questions) are added up and then divided by the total number of questions. The resulting number is the GDS value. 0 represents no distress and 4 represents the maximum level of distress.
Q: What is the minimum number of ACORNS needed to show progress in treatment?
A: Two
Q: in what direction do I want my client’s scores to be going on the graph, up or down?
A: Higher scores on the ACORN graph mean that clients are reporting that their overall level of distress is getting worse. When services are effective, we would expect the distress scores to go down and the direction of the graph to go down as well. This means that if their graph is moving up/scores are getting higher, they are telling us that they are getting worse. In these cases we should see if changes to services or referral to a higher level of care is indicated.
Q: When I’m looking at the client graph page, is there anything that I should prioritize paying attention to?
A: The direction of change in Global Distress Score (if it’s going up it means the client is doing worse) and/or Self Harm score(s)
Q: What is the Clinical Boundary?
A: The clinical cutoff score ACORN uses was determined by Jacobson and Truax in a 1991 article where they compared a community sample to a clinical one. (https://content.apa.org/record/1991-16094-001)
It refers to a score that is presumed to represent the boundary between "normal" and the "clinical range" on an outcome measure. The article linked above describes a method for calculating the clinical cutoff score for outcome measures in psychotherapy research. The formula requires the mean and standard deviation of both a clinical and non-clinical sample, and estimates the score at which a subject has a greater probability of belonging to a clinical sample rather than a non-clinical sample.
Another frequently used definition of "normal" is a score that falls within 1 standard deviation of the mean for a non-clinical sample. Subjects scoring more than a standard deviation above the mean of a non-clinical sample (85th percentile) are said to be in the clinical range. In practice, both methods tend to arrive at very similar cutoff scores.
It is worth noting that published reports indicate that at least 25% of patients seeking mental health services have test scores below the clinical cutoff score at the start of treatment. Patients with test scores in the normal range tend to have change scores near 0 or even in a negative direction. See Brown et al (2001) for further discussion of this phenomenon.
Toolkit Changes May 2023
Beginning on 5/27/23, you will notice some changes to the toolkit client progress graphs.
Q: What will change?
-Some colors in the legend have been changed
-The area under the “clinical boundary” will be green (indicating scores in this area are not in the clinical range).

-You will also see a pop up window that shows the various scores on a given data when you hover over them. This is called the “interactive graph”.

-By clicking on various items on the interactive graph legend, you can toggle between the different lines displayed. The example below shows the display for clicking on “GDS Score”.

-You can turn off the interactive graph and revert to a simple display view using this checkbox above the graph:

Q: What else will change?
You may notice some cases have been split up into other “episodes” of care. This would show up under the client’s graph like this:

The reason for this change is that different form types will now group together into cases. So for example, if a client used an outpatient questionnaire, then switched to a substance use recovery questionnaire, their cases would now be split into two. This is to help with accuracy of psychometrics in scoring different form types.
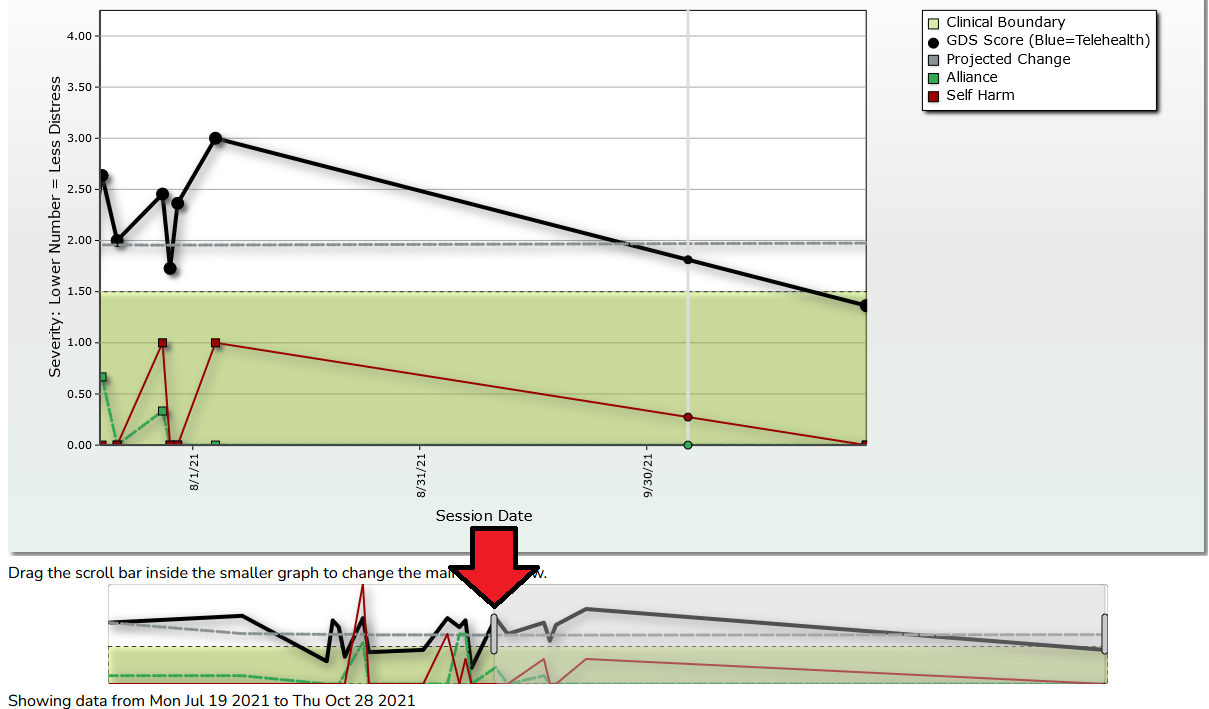
Graphs on long-term clients can get a bit crowded out, we’ve added a new feature to when using the interactive graph that will let you zoom in on any part of the graph to see it more clearly.
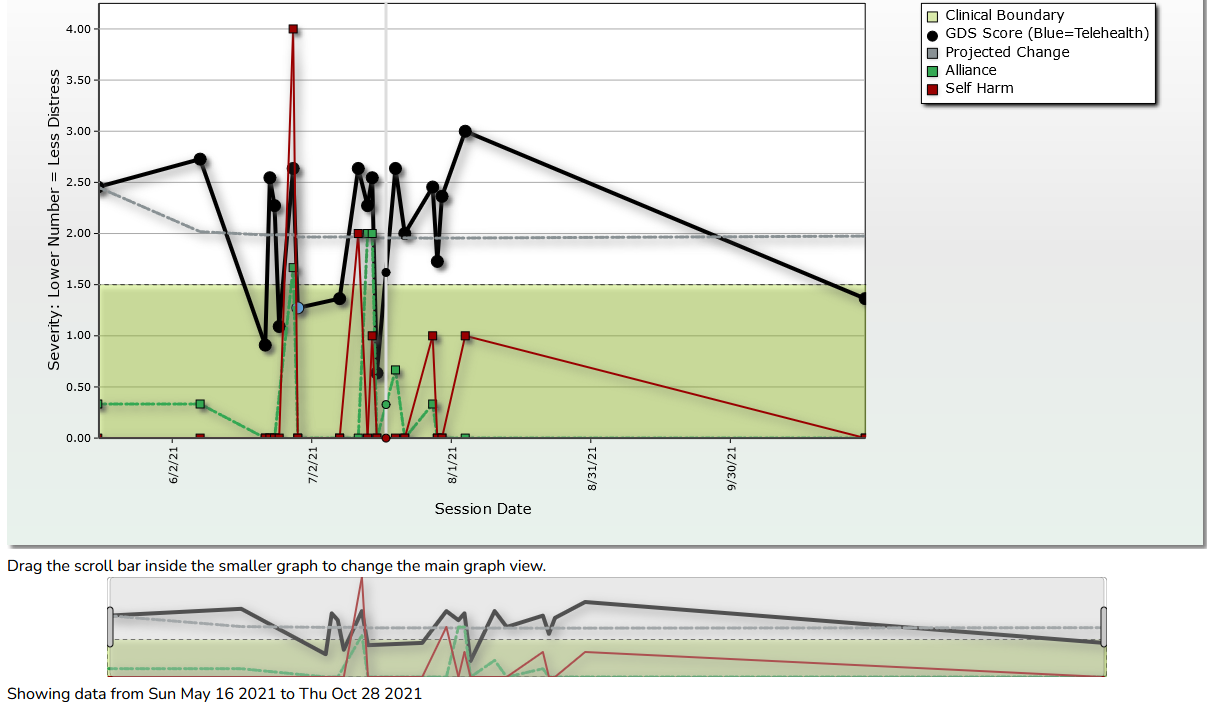
Clients with 10+ sessions will have a small overview graph beneath the graph, You simply need to grab the grey scroll bars (see red arrow below) and drag it left or right and your graph will update accordingly.
Reports

Q: How does a client end up on the “high risk cases” report?
A: The high risk cases report is informed by six variables including: current GDS; change on GDS Score; current risk of self harm; change on self harm score; current substance abuse; and change on substance abuse score. Also a clinical message in red will result in a client being included in the high risk report. If you have a client who is on this list it may be beneficial to discuss the following in supervision or think about on your own:
1. What specific concerns has ACORN identified that put the client on this list?
2. Do we have a plan to address those concerns?
3. Do we have other concerns about this client’s risk?
4. Do we need to change anything about how we are delivering services (e.g. frequency, modality, location, goals, etc.)?

Q: How does someone end up on the “transition report”?
A: Four consecutive sessions with GDS scores that come in below the clinical boundary line will cause a client to be added to the transition report. If you have a client who is on this list it may be beneficial to discuss the following in supervision and in session with the client:
1. Is client ready for discharge? If not, how will we know when they are?
2. What is our discharge plan?
Form Creation
Q: How do I request a custom form?
A: Not all questionnaires are created equal. To maintain high reliability and validity ratings, every adult ACORN form needs a total of...
Adult Questionnaires
13 (or more) questions.
Forms need at least:
● 5 questions from the symptom domain
● 2 questions from the social domain
● 1 question from the functioning domain
● 1 question from the risk domain
● 1 question from the substance domain
● 3 questions about alliance
● Additional questions can be selected from any domains you want, provided you can fit it on one page
Youth Questionnaires
18 (or more) questions.
Forms need at least:
● 5 questions from the symptom domain
● 2 questions from the social domain
● 1 question from the functioning domain
● 1 question from the risk domain
● 1 question from the substance domain
● 3 questions about alliance
● And then additional questions can be selected from any domains you want, provided you can fit it on one page
See the items available for use by clicking on the buttons below.
Administering the Form
Q: Why is the form given to the client at the beginning of a session and not the end?
A: There are two reasons we recommend administering forms at the start of a session.
1. ACORN items are designed to assess global distress, substance abuse, suicidal ideation over the recent past. When a clinician has the client fill out the form on a tablet, all of these questions are there at the beginning of the session to view. It's important to ask about symptoms, but this can get skipped as not everyone does a thorough check of sleep, self harm, and problems with substance abuse at every session. The bubbles are meant to help you quickly assess symptoms before the session.
For people who text their clients the questionnaire, we suggest they pull up the session form prior to the session via the toolkit. This can be done on your phone, or any device with a browser.
2. Because of the way the alliance section is designed. It asks about the client's last session (thus giving the form at the beginning gives you the most up to date information about how your therapeutic alliance is going.. are there red flags?). The reason for this is so to keep symptoms and alliance all on one form.
The alliance section used to be given in a separate questionnaire at the end. Clients did not like having to do two questionnaires. Thus, it was combined into the form format you see today.
Alliance
The home page of the ACORN toolkit shows a column of the most recent Alliance score on the client’s questionnaire. Low scores are color coded green and high scores are red.

Q: How does the alliance section work?
A: Therapeutic alliance has been found to predict psychotherapy outcomes more that treatment approach or experience of the therapist. But, there are a few things to know about making the most of your alliance feedback.
1. People will be polite and this is a problem. Those who report and excellent alliance early in treatment, and then mark it worse (even by a small amount) at the end of treatment (about 14%) have the worse results (average effect size of .6).
2. The pattern associated with the best outcomes is that the client gives feedback early in therapy that the alliance was not perfect...there is room for improvement in some area. As treatment progresses, the alliance scores then get better. Overall, about 41% of cases fit this pattern, with a mean effect size of .85. Those who report excellent alliance throughout therapy (about 45%) have a mean effect size of .78.
3. How do you get honest feedback? Communicate that you actually look at it, and continue to reference it throughout treatment. Need some tips?

Global Distress
The home page of the ACORN toolkit shows a column of the most recent Global Distress score (GDS) on the client’s questionnaire. Low scores are color coded green and high scores are red.

Q: What is Global Distress?
A: The PHQ9 and GAD7 are popular screening tools due to their wide spread usage and due to their high face-validity. For example, splitting up the questions to ask in myriad ways about anxiety looks useful. It is also very familiar in the primary care setting, which means many people get more exposure to these tools, as opposed to other screening measures.
What is ACORN measuring?
It turns out, when you factor analyze anxiety and depression, you do not see two separate factors. You see one common factor, which is called Global Distress. For this reason, ACORN doesn’t necessitate use of multiple types of questionnaires.
In ACORN questionnaires, you’ll notice items very similar to the PHQ9/GAD7. We ask about feeling down, sleep, eating, energy level, concentration and self harm. We have factor analyzed all of our items and we only use them if the correlate highly with the common factor: Global Distress.
So you can think of Global Distress as a many-in-1, something that assures you will catch symptoms for not only anxiety and depression, but risk indicators, social cohesion, and functioning impairments. While substance abuse and therapeutic alliance don’t correlate with GDS, we have separate subscales for them that you can break out on the case graph (see below).
Global Distress is shown over time by the black dotted line on the case graph.

Effect Size
The magnitude of improvement is reported as effect size. The use of the effect size statistic, also known as Cohen’s d, is important for benchmarking results since it provides a common metric independent of the questionnaire used (Cohen, 1988). ES is calculated as pre-post change divided by the standard deviation of the outcome measure at intake.
Most journals today require the use of effect size when reporting results. Many decades of research on psychotherapy outcomes yields an average effect size for psychotherapy of approximately 0.8. For this reason, we have classified effect sizes of .8 or greater as indicative of “highly effective” treatment.
An effect size of 1 means that the patient improved the equivalent of one standard deviation on the outcome measure. Effect sizes of 0.8 or higher are considered large, while effect sizes of 0.5 to 0.8 can be considered moderately large. Effect sizes of less than 0.3 are small and might well have occurred without any treatment at all.
The American Psychological Association has been officially encouraging authors to report effect sizes since 1994 - but with limited success."
-Robert Coe, Address to the British Educational Research Association.
Cases Without an Improvement Score
Q: Why do certain cases not get a Severity Adjusted Effect Size or Distribution of Patient Change graph?
A: There are two reasons:
-The case only has one assessment so far. Since the improvement score needs a pre and post change score to calculate, you’ll have to collect more data and then check again.
-The case in question is in the "Normal" (non-clinical) range. Since ACORN measures global distress over treatment, we don’t score clients who are not experiencing global distress. An analogy would be “if a patient isn’t sick, they can’t get better” (and therefore we can’t measure improvement).
Q: If my clients aren’t there in person, what can I do to get their responses on an ACORN questionnaire?
A: ACORN offers easy-to-use mobile forms. If you're unfamiliar with them, here's a quick video that shows you how to create and use them:
What else?
Most clinicians are familiar with our Mobile forms, but few know that ACORN also has a built in texting feature. Links to the mobile forms can be texted out to clients directly from ACORN, the client can then complete the form on their smartphone at which point you can view the image of their completed form on the Forms Processed page in ACORN.
To Text out a mobile form:
From the forms dropdown, select Mobile Forms.
Fill out the Site ID field (if applicable), make sure the clinician ID is correct, select the form you want to use and input this client's client ID.
Then click on the "Send Form Via" field and change the value from "Display URL" to "Text Message".
You will then see new options that allow you to designate what number to send this form to, along with the message they will see with the link.
Once they complete the form on their end and press the submit button, you will immediately be able to see their responses if you navigate to your "Forms Processed" page, located under your "Home" dropdown menu.
This video walks you through the process of looking at a client's form on the Forms Processed page.