Clinical Impact of School-based Interventions

G. S. (Jeb) Brown, PhD, Center for Clinical Informatics

Ashley Simon, Center for Clinical Informatics

Lindsay Foster, LCSW

Published on the Society for the Advancement of Psychotherapy

Abstract

AIM

This paper presents results of a five-year project to implement measurement and feedback processes, also referred to as feedback informed treatment, within seven agencies providing school-based mental health services to K-12 students. The purpose was to monitor rates of improvement on a measure of global distress over time.

METHOD

A standardized measure of improvement known as a severity adjusted effect size (SAES) was calculated for each child, using intake scores and diagnostic group as predictors in a multivariate regression model. A mean SAES for each year of the project was     the dependent variable used to evaluate the success of the initiative in improving outcomes. In addition, therapist engagement was monitored using a subset of 73 therapists with at least five cases using SAES scores during the final year of the initiative.  Engagement was measured by how often the therapist  logged into the clinical information system to view their results and the average SAES reported by clients.

RESULTS

SAES trended upwards strongly during the study period, from a bases of .44 during the first three years to .79 during the final year. This upward trend suggests that over all outcomes improved significantly, with results in the final year comparable to results from well controlled studies of various evidence-based treatments. Those clinicians demonstrating higher levels of engagement had an average client improvement of .88 compared to .72 for those with a lower level of engagement.

DISCUSSION

The data provides evidence that the combination of measurement and feedback can be a powerful tool for improving outcomes for school-based mental health services.

Purpose

The purpose of this report is to summarize results of an initiative to implement feedback informed treatment over a five-year period for children and adolescents receiving publicly funded mental health service in Maryland. Services were managed by a managed behavioral healthcare plan (MBHP), which supported the use of feedback informed treatment using ACORN questionnaires and the ACORN Decision Support Toolkit (Brown et al, 2015). ACORN questionnaires for youth and children contain 12-14 which inquire regarding levels of sadness, anxiety, loneliness, family/social isolation, functionality at school. These domains all load on a common factor referred to as global distress. In addition. two or three items inquired regarding the therapeutic alliance.

These questionnaires are administered at every session. The so call ACORN Decision Support Toolkit is a clinical information system that allow clinicians to view questionnaires and track client change over time. Clinical algorithms provide messages regarding risk factors. The Toolkit also allows the clinician to view the over all results and compare these to normative data based on results of several thousand other clinicians.

Methodology

QUESTIONNAIRES

Youths (or an adult who knew the child well) in grades kindergarten through 12th were asked to complete an ACORN questionnaire at every session. The therapists were licensed therapists and in some cases interns. The spacing of sessions varied depending on the child, with session duration being assumed to be typical of outpatient treatment (approximately 45 minutes). Questionnaires varied depending on the age of the child and other considerations. All questionnaires showed high reliability and construct validity. The Maryland sample is part of the larger ACORN normative sample of over 1.2 million clients and 3.2 million completed questionnaires (Brown et al, 2015).

DESCRIPTION OF SAMPLE

The sample consisted of children and adolescents starting treatment on or after January 1, 2014 through November 7, 2019.  A total of 11,571 cases had at least one completed questionnaire. Of these, 6,882 (59%) had at least two completed questionnaires.

Out of this sample, 7,561 had an intake score in the clinical range of severity for global distress as measured by the questionnaire. Of these, 4,506 completed at least two assessments. Those clients who completed at least two assessments were used to benchmark outcomes. This is due to the data finding that clients with intake scores below the clinical range tend to average no improvement, while those with intake scores in the clinical range tend to average significant improvement. Those clients with intake scores in the clinical range demonstrate improvement that is comparable to what is observed in clinical trials of various so-called evidence-based therapies.

CLINICIAN FEEDBACK

A significant body of psychotherapy research supports the practice of routine outcome measurement combined with algorithm-driven feedback to therapists to improve client outcomes. (Amble et al, 2014; Bickman et al, 2011; Brown et al 2001; Brown et al, 2015a; Goodman et al, 2013; Hannan et al, 2004; Lambert, 2010a; Lambert, 2010b).

To receive this feedback, clinicians needed to log into their personal Toolkit account to view their data. When they did so, they received personalized feedback on questionnaire scores, client improvement and risk indicators for all the clients. In addition, they received feedback on their overall outcomes for their case load. The Toolkit also automatically logs how often users view their data.

MEASURING AND BENCHMARKING OUTCOMES

The ACORN Collaboration incorporates a well-developed and validated methodology for benchmarking outcomes, permitting comparison of results from one clinic to another and between clinicians (Brown, et al, 2015a). The basic metric is based on the standard metric used in research studies: effect size. This is defined as the pre-post change score divided by the standard deviation of the client in question. It is only applied to cases that start treatment in the clinical range for symptom severity and that have at least two measurement points during treatment.

ACORN utilizes an advanced form of the effect size statistic, SAES, that accounts for differences in diagnosis, severity of symptoms and intake, and other relevant variables. When making comparisons between individuals, the ACORN platform also adjusts for sample size. For a more complete explanation of these methods, see Are You Any Good as a Clinician? (Brown, Simon & Minami, 2015b)

Therapists (or agencies) with an average SAES greater than .5 are characterized as delivering effective care. Those with an average SAES of .8 or greater are classified as highly effective. By way of comparison, the average effect size for well conducted peer reviewed studies of so-called evidence-based treatments is approximately .8. This means that those agencies and therapists with a SAES of .8 or better are delivering results equal to or better than what would be expected from high quality research studies.

Results

MEASURED EFFECT SIZE FROM YEAR TO YEAR

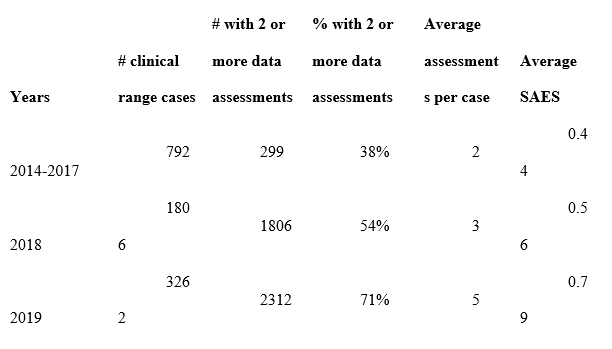
The following table and graphs break down results by calendar years. Results for 2014-2017 are combined because of the low case counts for those years. Beginning in 2017, the MBHP with assistance from Elizabeth Conners, PhD and others at the University of Maryland, along with county school district staff, placed more emphasis on participation in the program for providers of school-based service. The resulting increase in participation is evident and 2018 and 2019.  In all, seven agencies contributed to this data.

Table 1 displays the increase in effect size over five years. The increase in SAES is impressive and highly significant.  However, the number of assessments per case also increased, indicating that the questionnaires were probably being administered more consistently. This may have been in part due to a shift away from paper forms to use of inexpensive tablets to administer the questionnaires. Prior to 2017, 97% of forms were submitted by fax. From January 1, 2017 to date, only 15% came in via fax. This also had the effect of significantly reducing the cost of program for MBHP.

There was a weak (Pearson r=.17) but statically significant (p<01) correlation between session count and effect size.

Table 1

t 1.png

Graph 1

Picture1.png

Earlier published reports using ACORN data have revealed a consistent relationship between effect size and how often a clinician views their data via the ACORN Toolkit (Brown et all, 2015a). This appears to be the case with this sample also. During the final year, those clinicians with at least five cases in the clinical range who logged in at least 24 times had an average effect size of .86 (n=54 clinicians) compared to .74 for those who logged in less frequently (n=19 clinicians). The difference in significant at p<.05 (One tailed t-test).

To further test this hypothesis, we selected a sample of clinical range cases based on how many years the clinician had participated in the program, and then analyzed results from their second year of participation. This permitted us to look at clinician effect size change over time and a function of effect size in year one, session count in year two, and engagement (login count) in year two.

Table 2 displays the results for 1,512 youth and children seen by clinicians in their second year of participation in the program. These are broken out by those seen by therapists with high engagement (at least 24 logins) in the second year compared with those with low engagement. Note that there is little difference in the assessment counts between the two groups. Graph 2 presents the results graphically while displaying the effective and highly effective ranges.   Highly effective indicates results comparable to or superior to well conducted clinical trials of evidence-based practices.

Table 2

Untitled.png

Graph 2

Picture2.png

Using a General Linear Model to control for the assessment count for each case, the therapist’s SAES in year one, and the therapist’s level of engagement year two, we found a strong trend for the effect of engagement in year two (p<.10) despite controlling for these other variables.

Taken together, these results provide additional evidence that those clinicians who are actively engaged in receiving feedback are likely to deliver more effective services regardless of the number of sessions. This difference is large and clinically meaningful. Consistent with findings using the entire ACORN sample of therapists, it also appears that engagement in seeking feedback is associated with improvement over time.

Discussion and Implications for the Future

The number of clinicians participating actively in the use of the ACORN Toolkit increased significantly during 2019 as part of a quality improvement initiative spear headed by the MBHP and local school district, with active support with Elizabeth Conners, PhD at Yale University.

Unfortunately, funding was discontinued in 2020 when the MBHP lost the contract to manage this population in Maryland. Fortunately, five of the seven treatment organizations participating in the collaboration continued at their own expense, without the support from the MBHP. The gains in effect size observed in 2019 were largely maintained during 2020, however; due to the impact of COVID-19, the sample sizes of therapists and clients were smaller, and were not included in this report.

The ACORN collaboration continues to seek out funding to support these agencies as students begin to return to school and therapists once again can provide the full range of school-based services.

Summary

The data provide strong evidence of the effectiveness of school-based mental health services and supports the hypothesis that measurement and feedback can increase the effectiveness of these services. Now, perhaps more than ever, there should be a focus on improving the outcomes of children's mental health. We may never know the extent of the impact the pandemic has had on children’s mental health. However, we have the opportunity to track and in return improve students' mental health outcomes by implementing feedback informed treatment
Ashley Simon