Beginning on 5/27/23, you will notice some changes to the toolkit client progress graphs.
Q: What will change? -Some colors in the legend have been changed
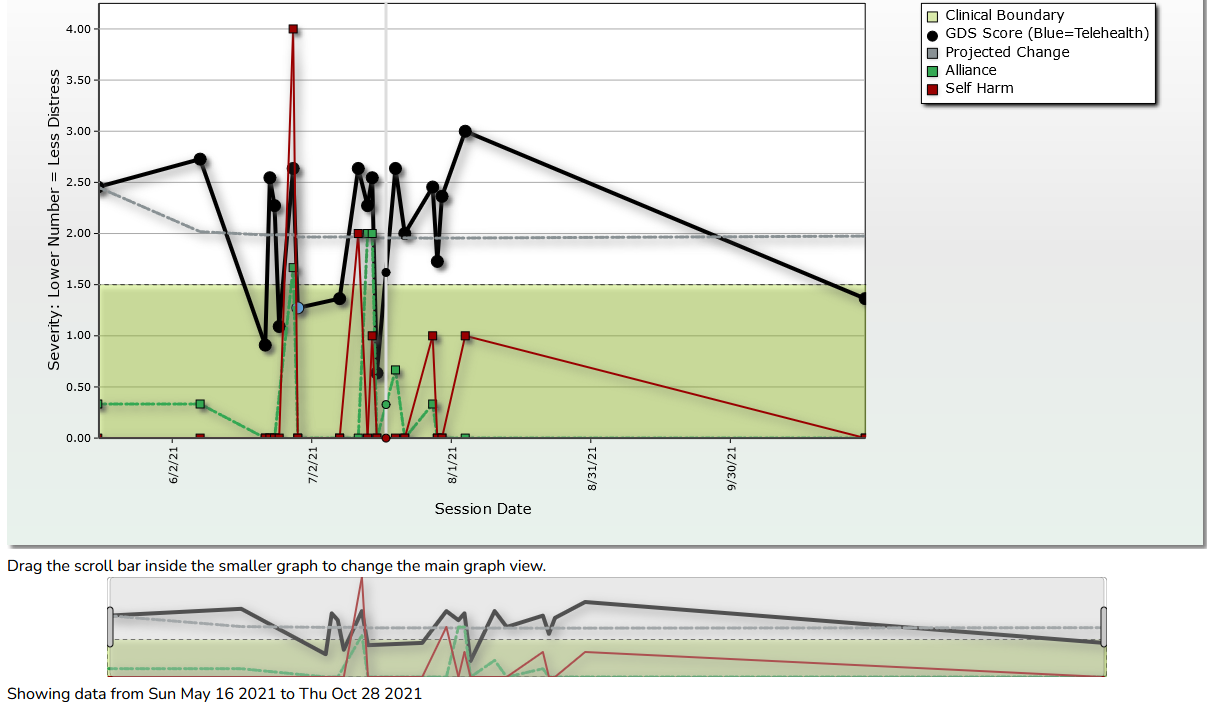
-The area under the “clinical boundary” will be green (indicating scores in this area are not in the clinical range).
-You will also see a pop up window that shows the various scores on a given data when you hover over them. This is called the “interactive graph”.
-By clicking on various items on the interactive graph legend, you can toggle between the different lines displayed. The example below shows the display for clicking on “GDS Score”.
-You can turn off the interactive graph and revert to a simple display view using this checkbox above the graph:
Q: What else will change?
You may notice some cases have been split up into other “episodes” of care. This would show up under the client’s graph like this:
The reason for this change is that different form types will now group together into cases. So for example, if a client used an outpatient questionnaire, then switched to a substance use recovery questionnaire, their cases would now be split into two. This is to help with accuracy of psychometrics in scoring different form types.
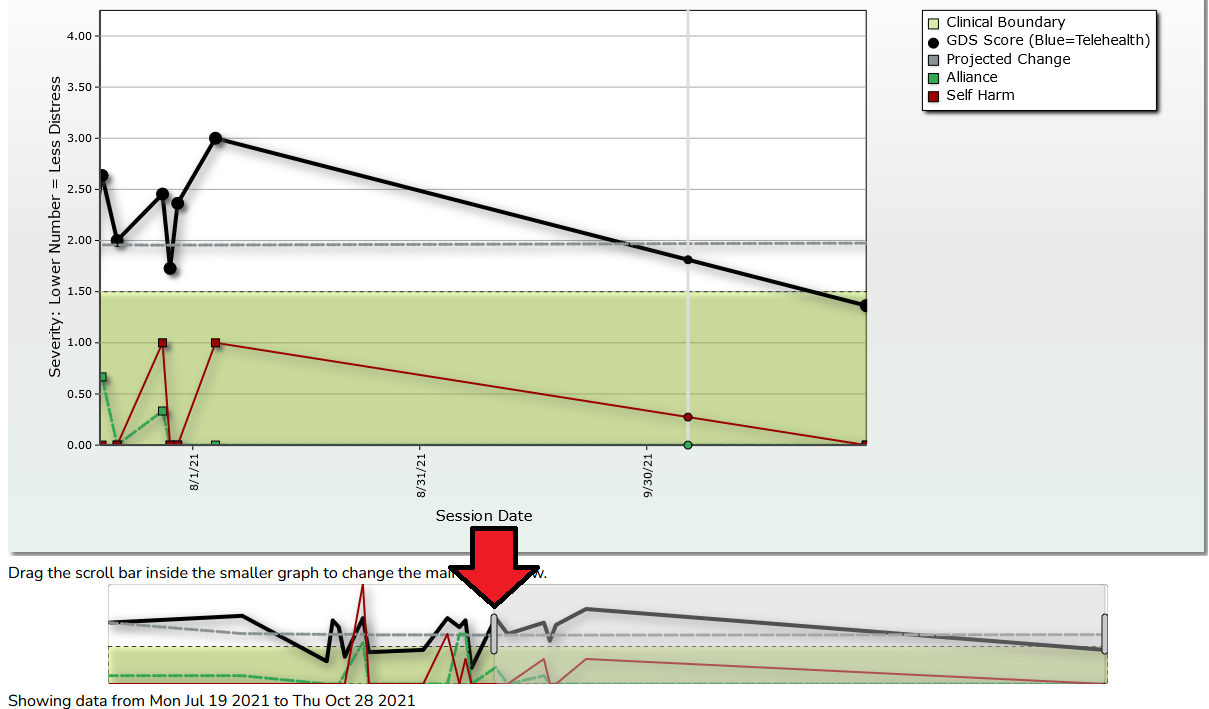
Graphs on long-term clients can get a bit crowded out, we’ve added a new feature to when using the interactive graph that will let you zoom in on any part of the graph to see it more clearly.
Clients with 10+ sessions will have a small overview graph beneath the graph, You simply need to grab the grey scroll bars (see red arrow below) and drag it left or right and your graph will update accordingly.