Clinician Engagement in Feedback Informed Treatment (FIT) and Patient Outcomes
Jeb Brown, Ph.D, Center for Clinical Informatics
Christophe Cazauvieilh, Ph.D, IRPPSY and University of Bordeaux, France
Introduction
The purpose of this brief report is to present findings observed on the relationship between clinicians engaged in feedback informed treatment and patient outcomes within the same time period. Clinician engagement was measured by the frequency with which clinicians logged into the ACORN Toolkit to view their data.
The report is intended to present findings in a simple format with easy to interpret graphs to assist is visualizing the distribution of results. More detailed reporting on results are available upon request.
The report is primarily geared towards participants within the ACORN Collaboration and assumes a familiarity with the web bases application ACORN Decision Support Toolkit and the metrics used to report clinical outcomes.
Background
Prior analyses conducted in collaboration with the ACORN Scientific Advisory Committee has revealed an association between the frequency with which a clinician views their data and the distribution of the patient outcomes as evaluated using the Severity Adjusted Effect Size (SAES). SAES is a metric that controls for differences in severity of distress at intake, diagnostic group, and session number of the first assessment. (Brown, Simon, Cameron & Minami, 2015)
Tracking clinician effectiveness as well as the frequency of Toolkit usage over a period of several years has revealed that outcomes tend to vary with the concurrent use of the Toolkit. For example, a clinician with excellent results in one year who then tends to log in much less often the the following year is more likely to see results go down compared to a clinician who continues to log in with adequate frequency.
The present set of analyses is intended to demonstrate this and other phenomenon through use of easy to understand results supported by graphs.
Selection criteria
A sample of therapists was identified based on two criteria:
-those associated with a sample of at least 100 clinical range cases with multiple assessments prior to January 30, 2018
-at least 15 similar cases in the 12 months following.
The estimated effect size of the sample was calculated using the ACORN methodology for evaluating therapists’ outcomes. The mean Severity Adjusted Effect Size (SAES) was calculated for each therapist, using Hierarchical Linear Modeling to adjust for sample size. For a more complete explanation of these methods and results, see Are You Any Good as a Therapist? (Brown, Simon & Minami, 2015)
Out of a total of 2404 clinicians submitting data during the past 12 months, 317 clinicians met the criteria described above. The mean SAES (calculated at the therapists’ level) for this sample of therapists was .83 for the past 12 months, and .82 for all years prior to that. By way of comparison, the mean SAES for all cases in the ACORN database during the past three year is .82 (n=159,989). This indicates that the outcomes for the group of clinicians included in the sample is comparable to the larger sample of ACORN participating clinicians.
The sample was divided into three groups of effectiveness:
1. low effectiveness (results in lower 25%; effect size < .72; N=75)
2. average effectiveness (results in middle 50%; N=160)
3. high effectiveness (results in upper 25%; effect size >.91; N=82)
In order to investigate the predictive validity of these therapists’ rankings, a sample of their clinical range cases who were treated during 2018 were selected for further analyses (n=14,638). The mean SAES for this sample is .835.
As expected, the therapists’ estimated mean SAES prior to 2018 was significantly correlated with their clients’ effect sizes in 2018 (Pearson r=.15, p<.0001). The following graph displays the mean effect sizes for patients treated by the groupings of therapists during the most recent 12 months. The differences in mean SAES are large (p<.0001) and clinically meaningful.


The following graph displays the distribution of individual client effect sizes for the three different groups of therapists. A client at the 50th percentile for SAES treated by a clinician in the High Effectiveness group has a better result than about 58% of these treated by the Medium Effectiveness group and 64% treated by the Low Effectiveness group.

Therapist Engagement in Feedback Informed Care
Therapist engagement in receiving feedback on results was assessed by the frequency with which therapists logged into the Toolkit to view results. Prior analyses have revealed that this is not a linear relationship; more logins do not necessarily result in better outcomes. Rather, there appears to be a threshold effect, login in enough results in better outcomes but logging in much more does not result in even better results. On the other hand, logging in below the threshold frequency is associated with worse results, and it doesn’t matter if the clinician never logged on or only logged in infrequently.
These analyses revealed that the threshold for benefit appears to be approximately 24 logins per year, or an average of twice a month. Based in this criterium, 148 (47%) of the clinicians were classified as High Engagement while 169 (53%) were classified a Low engagement.
The probability of a clinician being classified as High Engagement differed significantly by their effectiveness level, with High Effectiveness clinicians more likely to be engaged than Low Effectiveness.

During the past year, those clinicians classified as High Engagement were significantly more effective during the past year, averaging .19 greater SAES. This is both statistically significant (p<.0001) and clinically meaningful.


Note that High Engagement clinicians accounted for over two thirds of the sample in the past year, indicating that there is a significant association between the number of cases for which they have data and their likelihood of being highly engaged. A multivariate predictive model including case count in the current year revealed that prior years effectiveness was the most significant predictor, followed by engagement level. The case count variable did not reach a .05 level of significance.
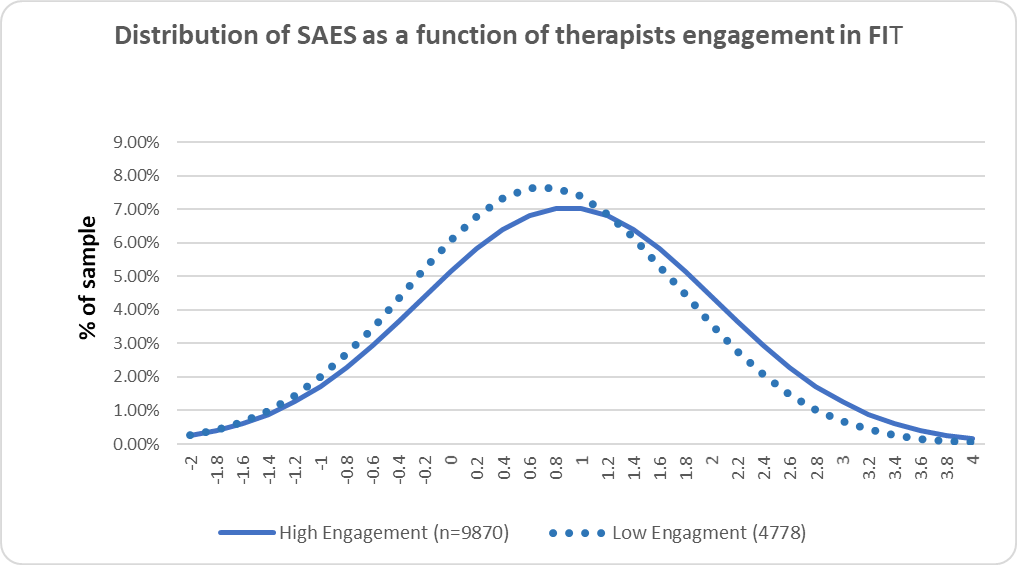
The following graph displays the distribution of results for individual cases. A client at the 50th percentile in the High Engagement clinician group had a better outcome than about 57% of clients in the Low Engagement group.
The breakdown on engagement varied greatly by clinician effectiveness group. For the High Effectiveness group, 84% of the cases were seen by high engaged clinicians, whereas in the Low Effectiveness group, only 46% were treated by highly engaged clinicians.
The differences in SAES between High Engagement and Low Engagement clinicians within each of the effectiveness groups were significant (p<.05). The differences between High Effectiveness -Low Engagement and Medium Effectiveness-High Engagement, as well as between Medium Effectiveness-Low Engagement and Low Effectiveness -High Engagement did not reach this level of significance. This dramatically illustrates the impact of Engagement in FIT during the current year, regardless of level of Effectiveness in prior years.


The following graph displays the distribution of clients’ outcomes based on engagement during the past 12 months. Note that high engagement is associated with larger standard deviations. Better outcomes are not being achieved by reducing variability in outcomes, but rather by shifting the distribution in a positive direction while increasing the variation.

Discussion
This data set provides compelling evidence that clinician engagement in receiving feedback on outcomes is associated with significantly larger effect sizes of clients. The mechanism for this effect is unclear.
Clinician engagement was measured simply by counting a behavior, how often the clinician logged into the website to view their data. Clinician engagement was voluntary, though incentives vary from location to location. Some clinics encourage and monitor clinician engagement to a larger extent than others and typically have higher levels of engagement.
One take way from these analyses is that it doesn’t matter how effective a clinician believes they are, continued engagement in FIT is associated with better outcomes.
The unanswered question is why the results for highly engaged clinician are better. What are they doing differently, beyond simply logging in to look at results?
To better understand what clinicians do once logged in, the ACORN Toolkit application was enhanced this past year to track page views and individual patient graphing views in more detail. However, it is too early to draw any conclusions from this data.
One feature of the ACORN Toolkit is that clinicians are provided with continuous feedback on their overall effectiveness and well as information on individual cases. It perhaps should not be surprising that real time performance feedback results in better performance. How exactly are clinicians using the information they are provided with?
Next Steps
We suggest creating a clinician completed questionnaire regarding clinician Toolkit usage that elicits their thoughts on the information provided, and how the information augments their clinical judgement of a case.
Over the coming months we propose reaching out to ACORN participants and other potential academic collaborators to formulate a clinician completed questionnaire which can be used explore the clinicians’ understanding of the value of the information and how it is used in their clinical work. This is a necessary step in further understanding how to best to assist clinicians to improve their personal effectiveness.